
Serverless data pipeline for near real-time monitoring on billions of edge events
Kaushik Krishnamurthi
Staff ML Data Engineer
Machine Learning, Advanced Technologies Group
Seattle, WA
At Metropolis, we are redefining experiences like parking using cutting-edge computer vision. Our network of edge devices and cameras is the backbone of our checkout-free parking system. These devices are constantly processing information, recognizing vehicles, and ensuring a seamless experience for our customers.
With 10,000+ devices deployed across 1,000+ locations, ensuring their health and performance is paramount. Each device generates a stream of log data for every event: a vehicle entering, the vehicle being recognized, a gate opening, etc. To operate at scale, our Machine Learning team needed to move beyond simply storing this massive data stream and harness it for near real-time insights to support internal customers like our Engineering (Software and Hardware) and Tech Operations teams.
This blog post details how we built a robust, near real-time big data pipeline using AWS and Snowflake to monitor the health and performance of our entire fleet of edge devices. While many of the components are industry standard, our key achievement is the combination of massive scale and low latency — processing over a billion events weekly with an end-to-end speed of roughly 15 minutes — all built on a highly efficient, managed stack.
The challenge: Scaling high-volume, near real-time analytics
Our primary challenge was one of scale and speed. We needed to answer critical questions in near real-time, surfacing the answers on an interactive dashboard for our technical organization:
Is a specific location experiencing a high rate of failed vehicle recognitions?
Are the gates at a particular garage responding slowly?
Is a new software update causing an unusual number of errors on a specific device model?
The requirement was not for true, sub-second real-time, but for near real-time analytics — fast enough to allow our teams to act on issues within minutes, not hours.
A traditional batch-processing system, running daily or hourly, was too slow. In a high-volume parking facility, an hour-long delay in identifying a failing gate or a systematic recognition error can lead to a poor customer experience and operational bottlenecks. We needed a solution that could deliver these near real-time insights in a scalable and cost-effective way.
The core challenge was therefore not just technical, but methodological: How could we achieve this near real-time performance (“velocity”) at scale without building and maintaining a large, complex, custom infrastructure? We had a constant influx of complex, nested JSON data (“variety”) from our devices, which, after processing, explodes into a massive, structured dataset. Our pipeline processes and flattens this data, adding well over a billion new structured event rows (“volume”) to our core data tables every single week.
Our pipeline architecture
To tackle this, we designed a pipeline leveraging the strengths of AWS for data ingestion and Snowflake for processing, storage, and analytics. The entire end-to-end architecture is illustrated in the diagram below.
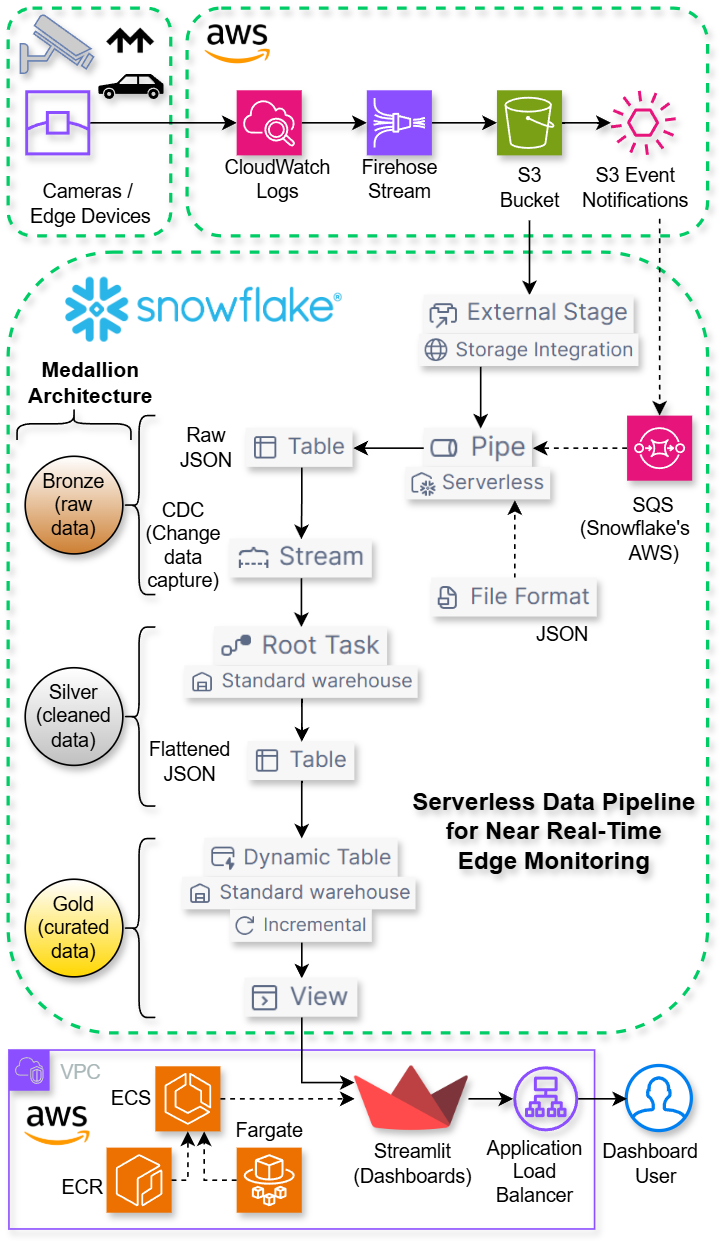
Structuring our data: the Medallion Model
To ensure data quality and provide a clear lineage, we conceptually structured our pipeline around the Medallion Architecture. This model organizes data into three distinct layers: Bronze, Silver, and Gold, each representing a higher level of quality and usability.
Bronze Layer (Raw Data): This is our data at its most raw state. This layer contains the complete, unaltered log data exactly as it arrived from the source. Its main purpose is to serve as our source of truth, providing a durable archive for reprocessing and debugging.
Silver Layer (Cleaned Data): The Silver layer contains data that has been cleaned, validated, filtered, and structured. In our pipeline, this is the stage where the raw JSON is parsed, schemas are enforced, and the data is organized into clean, queryable columns, making it ready for analysis.
Gold Layer (Curated Data): This is the highest quality data, often aggregated and prepared for specific business use cases. This layer is optimized for consumption by our analytics tools, providing curated, near real-time views that power our dashboards.
Pipeline implementation
Here’s a step-by-step breakdown of how data flows from the edge to our dashboards.
1. Data Ingestion: From Edge to S3
Our services running on the edge devices are configured to send JSON logs (semi-structured data) to Amazon CloudWatch. For every event — vehicle entry, exit, payment processing, etc. — a log is generated. From CloudWatch, we use Amazon Data Firehose to reliably stream these logs and batch them into JSON files, delivering them to a dedicated Amazon S3 bucket.
2. Automated Ingestion: Snowflake’s Snowpipe (Bronze Layer)
Once the data lands in S3, we load it into Snowflake automatically using Snowpipe. We chose Snowpipe, over a custom COPY pipeline, as its serverless simplicity and native handling of JSON (including gzip compressed JSON files) perfectly matched our near real-time goal by seamlessly managing file detection and its own compute resources. The setup involves an External Stage pointing to our S3 bucket and Snowpipe, which uses an SQS queue to listen for new file events. It’s important to note that this SQS queue is hosted and managed by Snowflake within its own AWS account. We simply configure our S3 bucket to send event notifications to its ARN (Amazon Resource Name). We were able to configure all of these components directly within Snowsight, Snowflake's web UI. This streamlined the setup and simplified governance by making our data assets automatically discoverable in the integrated Snowflake Horizon Catalog. This entire ingestion flow is event-driven and operates in real-time. As soon as logs are delivered to S3, they are queued and loaded into our Bronze table within moments. This table currently stores hundreds of millions of raw, nested JSON logs as our source of truth.
A Note on Ingestion Design: While Amazon Data Firehose offers a native destination that loads directly into Snowflake, we made a conscious architectural choice to use our S3 bucket as an intermediary. This S3-first approach is foundational to our data platform design. By landing the data in our S3 bucket, we create a persistent, platform-agnostic Bronze layer (our source of truth). This gives us the flexibility to reprocess the entire data history at any time and allows other analytics engines (like Amazon Athena or Apache Spark) to access the raw data without ever touching Snowflake. It's a more robust and future-proof design that prevents vendor lock-in.
3. Near Real-Time Transformation: Streams and Tasks (Silver Layer)
Our raw event data sits in a single VARIANT column. To begin the transformation process, we created a Stream on our raw table to capture new records efficiently (Change Data Capture). A scheduled Task then reads from this stream, uses LATERAL FLATTEN to parse the JSON, and inserts the clean, structured, flattened (exploded) JSON data into a second, more organized Silver table.
Example: Using LATERAL FLATTEN to un-nest events
Sample single row of raw input data:
LOG_GROUP |
LOG_STREAM |
LOG_EVENTS (VARIANT) |
/metropolis/prod/service-alpha |
prod-instance-12345 |
|
Transformation SQL query:
SELECT
  r.LOG_GROUP,
  r.LOG_STREAM,
  -- Snowflake's ability to directly query nested JSON fields simplifies parsing.
  f.value:id::STRING AS LOG_ID,
  f.value:message::STRING AS LOG_MESSAGE,
  -- Convert Unix milliseconds to a Snowflake timestamp.
  CAST(TO_TIMESTAMP_NTZ(f.value:timestamp::NUMBER / 1000) AS TIMESTAMP_NTZ(6)) AS LOG_TIMESTAMP,
  -- Create a date column to use as the CLUSTER BY key for Silver table performance.
  TO_DATE(LOG_TIMESTAMP) AS LOG_DATE
FROM
  EDGE_DB.BRONZE.RAW_STREAM_CDC r,
  LATERAL FLATTEN(input => r.LOG_EVENTS) f;
Sample multiple rows of exploded output data:
LOG_GROUP |
LOG_STREAM |
LOG_ID |
LOG_MESSAGE |
LOG_TIMESTAMP |
LOG_DATE |
/metropolis/prod/service-alpha |
prod-instance-12345 |
1234 |
2025-10-21_18:15:01.123: INFO : EventTypeA |
2025-10-21 18:15:01.123 |
2025-10-21 |
/metropolis/prod/service-alpha |
prod-instance-12345 |
5678 |
2025-10-21_18:15:02.456: INFO : EventTypeB |
2025-10-21 18:15:02.456 |
2025-10-21 |
We made a deliberate architectural choice to schedule this task to run every minute. This micro-batch approach is significantly more cost-effective and operationally simpler than a true, sub-second streaming transformation, and it's fast enough to feed our 15-minute near real-time dashboards. This ensures our Silver table’s data closely trails the raw ingestion.
The flattening process is key, as a single complex log from the Bronze table can contain dozens of individual events, which become separate rows in this layer. This explains why our Silver table is constantly growing at a rate of over a billion rows per week.
A Note on Performance: We explicitly create the LOG_DATE column to define it as the CLUSTER BY key for our Silver table. Since this table grows by over a billion rows per week, clustering by date is critical for performance. It co-locates data from the same date in the same storage micro-partitions. This allows Snowflake's query optimizer to perform partition pruning, skipping the vast majority of the table's data for any query with a date filter (e.g., WHERE LOG_DATE = '2025-10-20'). This makes our analytical queries significantly faster and more cost-efficient.
4. Serving Fresh Data: Dynamic Tables (Gold Layer)
For our dashboards, we needed to provide our teams with data that was both fresh and fast to query. While our structured data table contains billions of historical rows, querying it directly for every dashboard load would be too slow.
To solve this, we used Snowflake's Dynamic Tables. We created a Dynamic Table designed to contain a rolling window of the latest one hour of data. This choice keeps the dataset small and highly performant, ensuring that the dashboards load with low latency, even when accessed by many of our teams simultaneously. We've configured this table with a target lag of 15 minutes, guaranteeing that the experience is always near real-time. The table represents the latest tens of millions of rows.
5. Visualization: The Streamlit Dashboard
The final piece is our interactive dashboard, a custom Streamlit application. To deploy it, we containerize the application using Docker and store the resulting image in Amazon ECR. The application is deployed as a persistent service on Amazon ECS that launches and maintains our application as ECS tasks running on the Fargate serverless compute engine. This approach separates our data layer in Snowflake from our presentation layer on AWS, giving us flexibility and control.
This dashboard has become a critical tool used across our technical organization. It serves several critical functions: monitoring the near real-time health of our devices, providing observability into event patterns, and delivering actionable insights that help us proactively address issues in the field.
The result: An end-to-end, near real-time solution
By leveraging real-time ingestion and automated transformations, we've built a powerful, efficient, and scalable near real-time solution that transforms an event at a parking garage into a data point on a dashboard in about 15 minutes. What makes this architecture so effective is its operational simplicity. By composing fully managed services, our team can focus on data insights rather than infrastructure management, even at this immense scale.
Our teams are now empowered to proactively identify and address issues at our locations before they impact our customers, ensuring the reliability and performance of our service.
What's next?
Creating Historical Dashboards: Our current dashboard is optimized for recent 1-hour data monitoring. We also plan to create a new set of dashboards for historical analysis. These will be powered by new aggregated Gold tables (e.g., daily and weekly rollups) that allow our technical teams to analyze long-term performance and operational trends without directly querying the massive multi-billion-row Silver table.
Enhancing Automated Alerts: In addition, we will move beyond visual monitoring of Gold datasets by enhancing our automated alerting with insights from them. Using advanced log analytics, such as time-series anomaly detection techniques, to identify critical patterns in real-time will allow us to trigger immediate alerts to our engineering teams, significantly reducing our time to resolution.
Building a Data Lakehouse: To complement our near real-time pipeline, we plan to build a Data Lakehouse architecture using open standards like Apache Iceberg on top of our analytical data. This will provide powerful features like schema evolution and time-travel, enabling more complex historical analysis and enhancing the long-term maintainability of our data assets. The resulting platform will also allow us to accelerate our iteration speed as we deploy our Vision system beyond parking.